A 33,817 SF, 100% leased multi-tenant industrial flex acquisition in one of the St. Louis MSA's most supply-constrained submarkets — anchored by four national and regional tenants, with in-place rents 28% below market and a clear path to mark-to-market upside over a 5-year hold.
Bluebird Commercial Real Estate acquired 201–215 Stag Industrial Blvd — a 33,817 SF, 100% leased multi-tenant industrial flex property in St. Charles County, Missouri — in July 2025 for a $3.60M purchase price ($106.46 PSF). The asset is anchored by four national and regional tenants on staggered leases, with in-place rents averaging $7.38 PSF NNN — a 28% discount to comparable submarket asking rents of $10.21 PSF. The 5-year business plan captures that gap through a disciplined renewal-and-roll strategy supported by sub-1% submarket vacancy and 5.4% historical rent growth.
Target returns are forward-looking estimates from the underwriting at closing — not guarantees. Returns shown are net to limited partners after the 2.0% acquisition fee, 2.0% asset management fee on EGI, 2.0% disposition fee, 10% preferred return, and 95/5 split to pref then 80/20 thereafter as outlined in the Fees & Promote section below.
Four reasons this asset offered compelling risk-adjusted returns at acquisition.
In-place rents average $7.38 PSF NNN versus comparable submarket asking rents of $10.21 PSF — a 28% gap captured through the rollover schedule over the hold.
Four national and regional tenants — including a publicly-traded electrical-distribution subsidiary — with no single tenant exceeding 30% of the building.
St. Charles County is one of the tightest flex submarkets in the St. Louis MSA — sub-1% vacancy in buildings under 50,000 SF, only 61,000 SF currently under construction (vs. 550,000 SF 10-year average).
WALT of 1.71 years at acquisition is a feature, not a flaw — three of four leases roll inside 24 months, accelerating the path to capturing market rent.
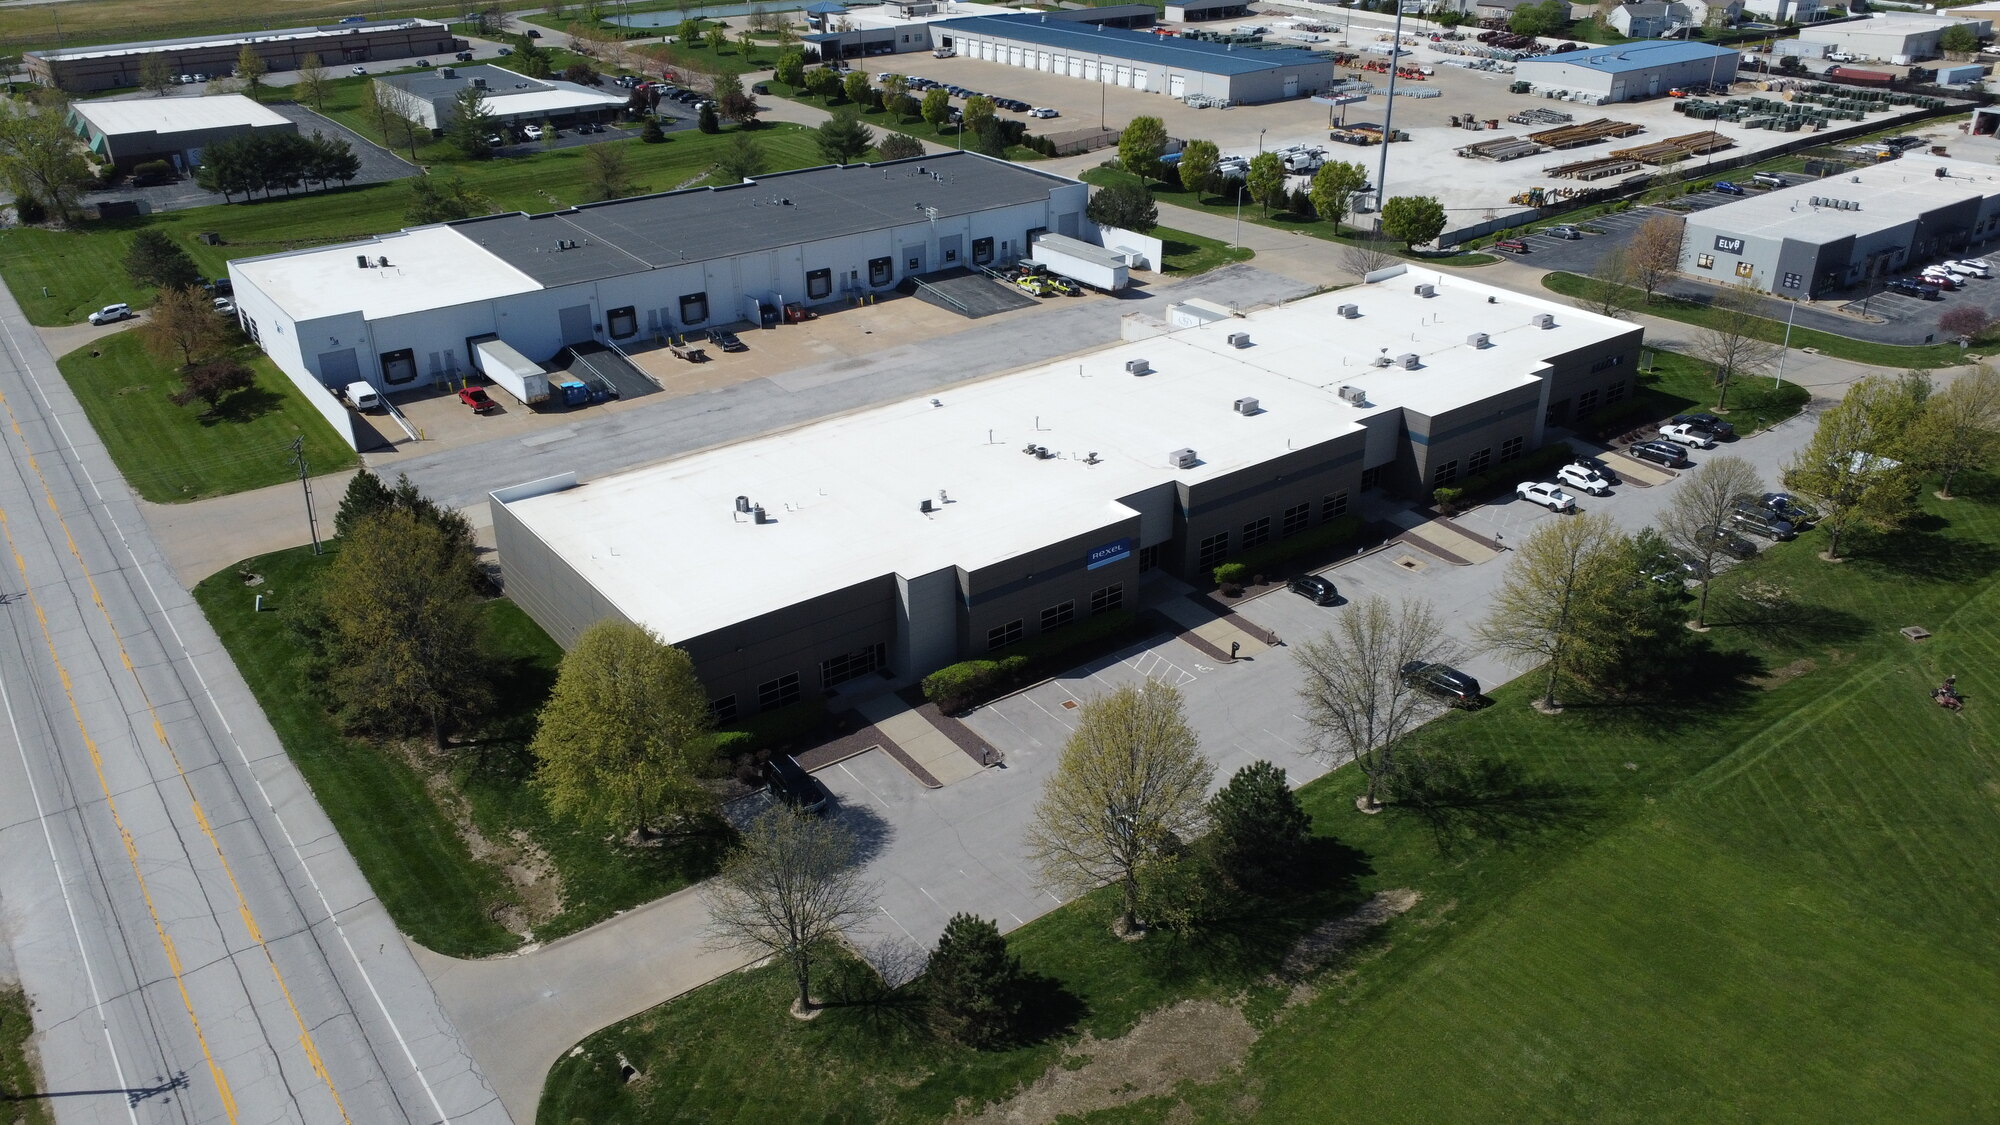
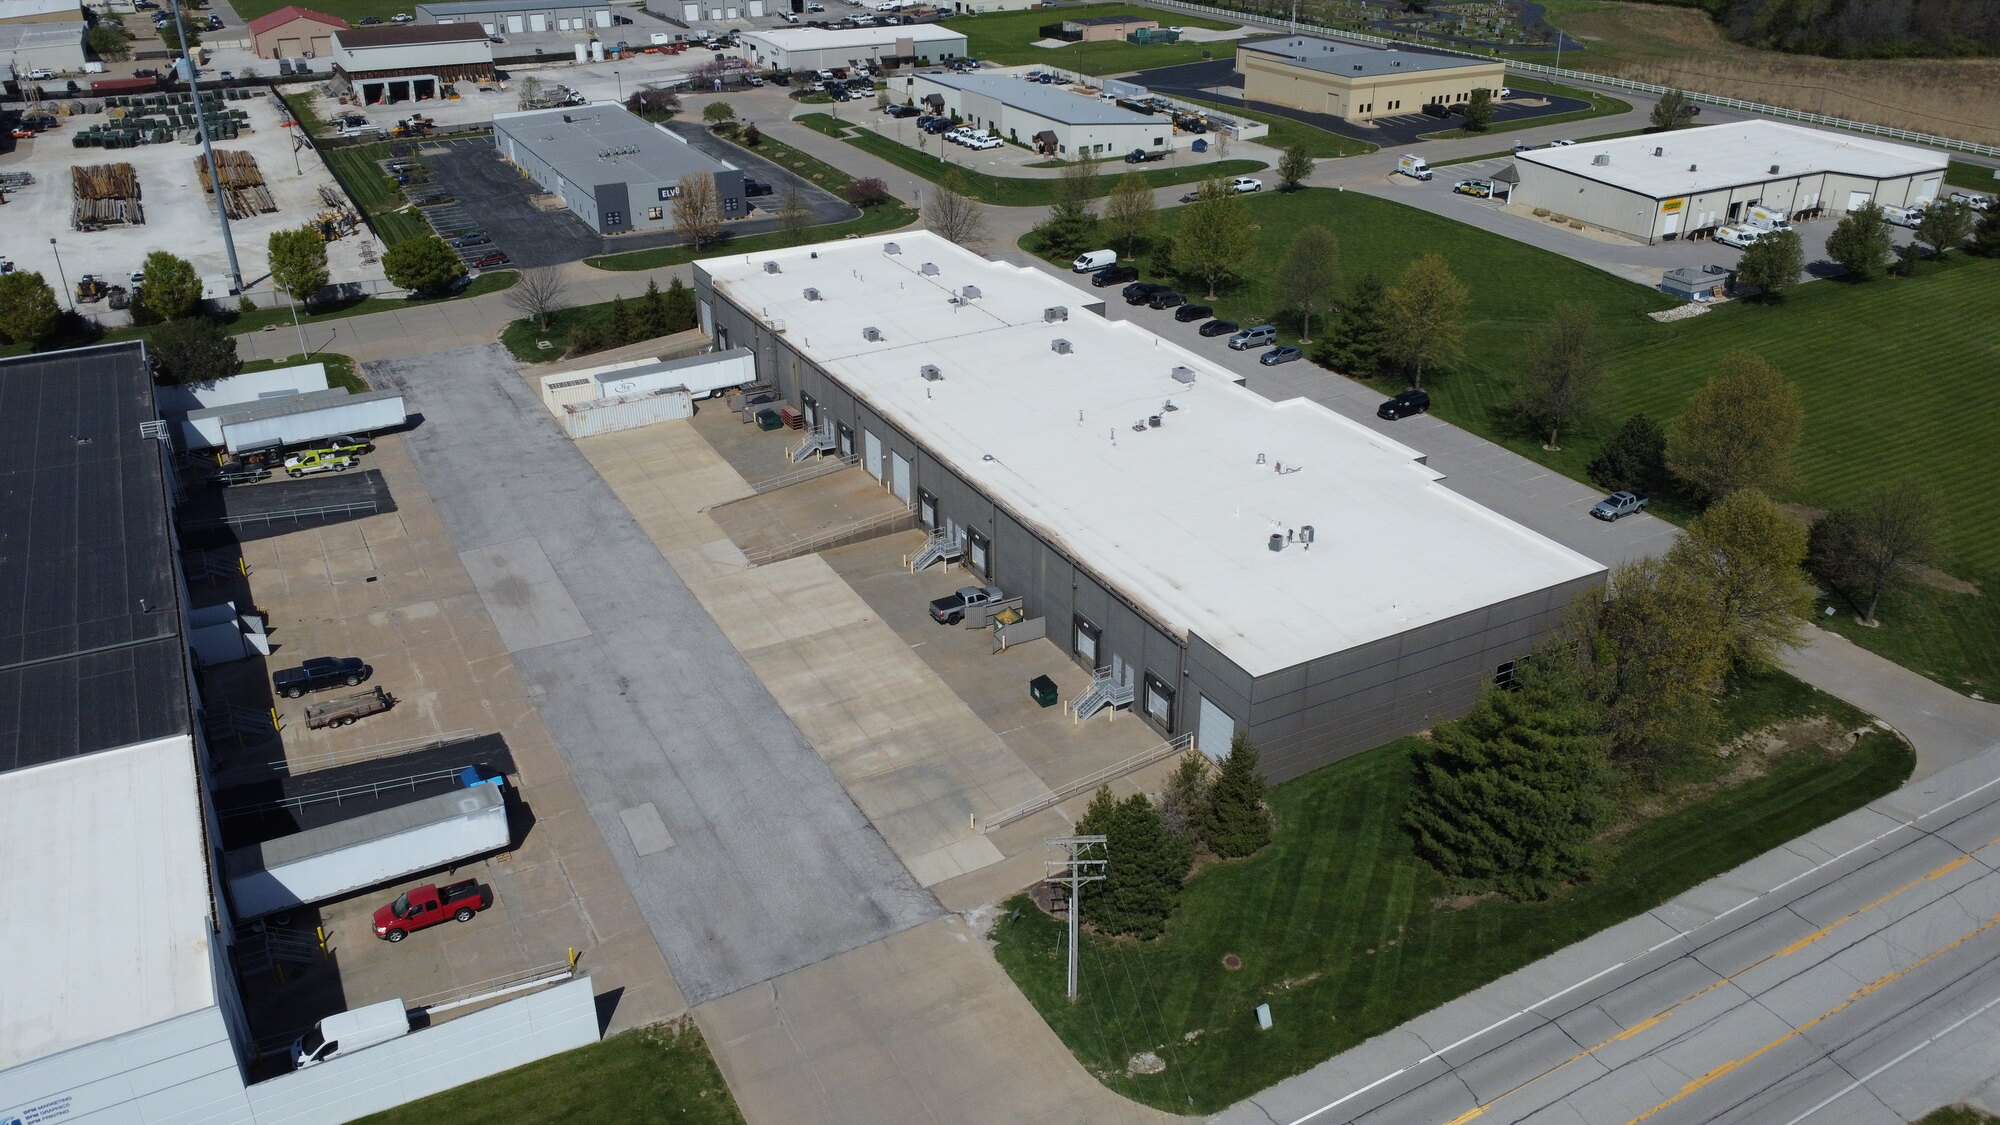
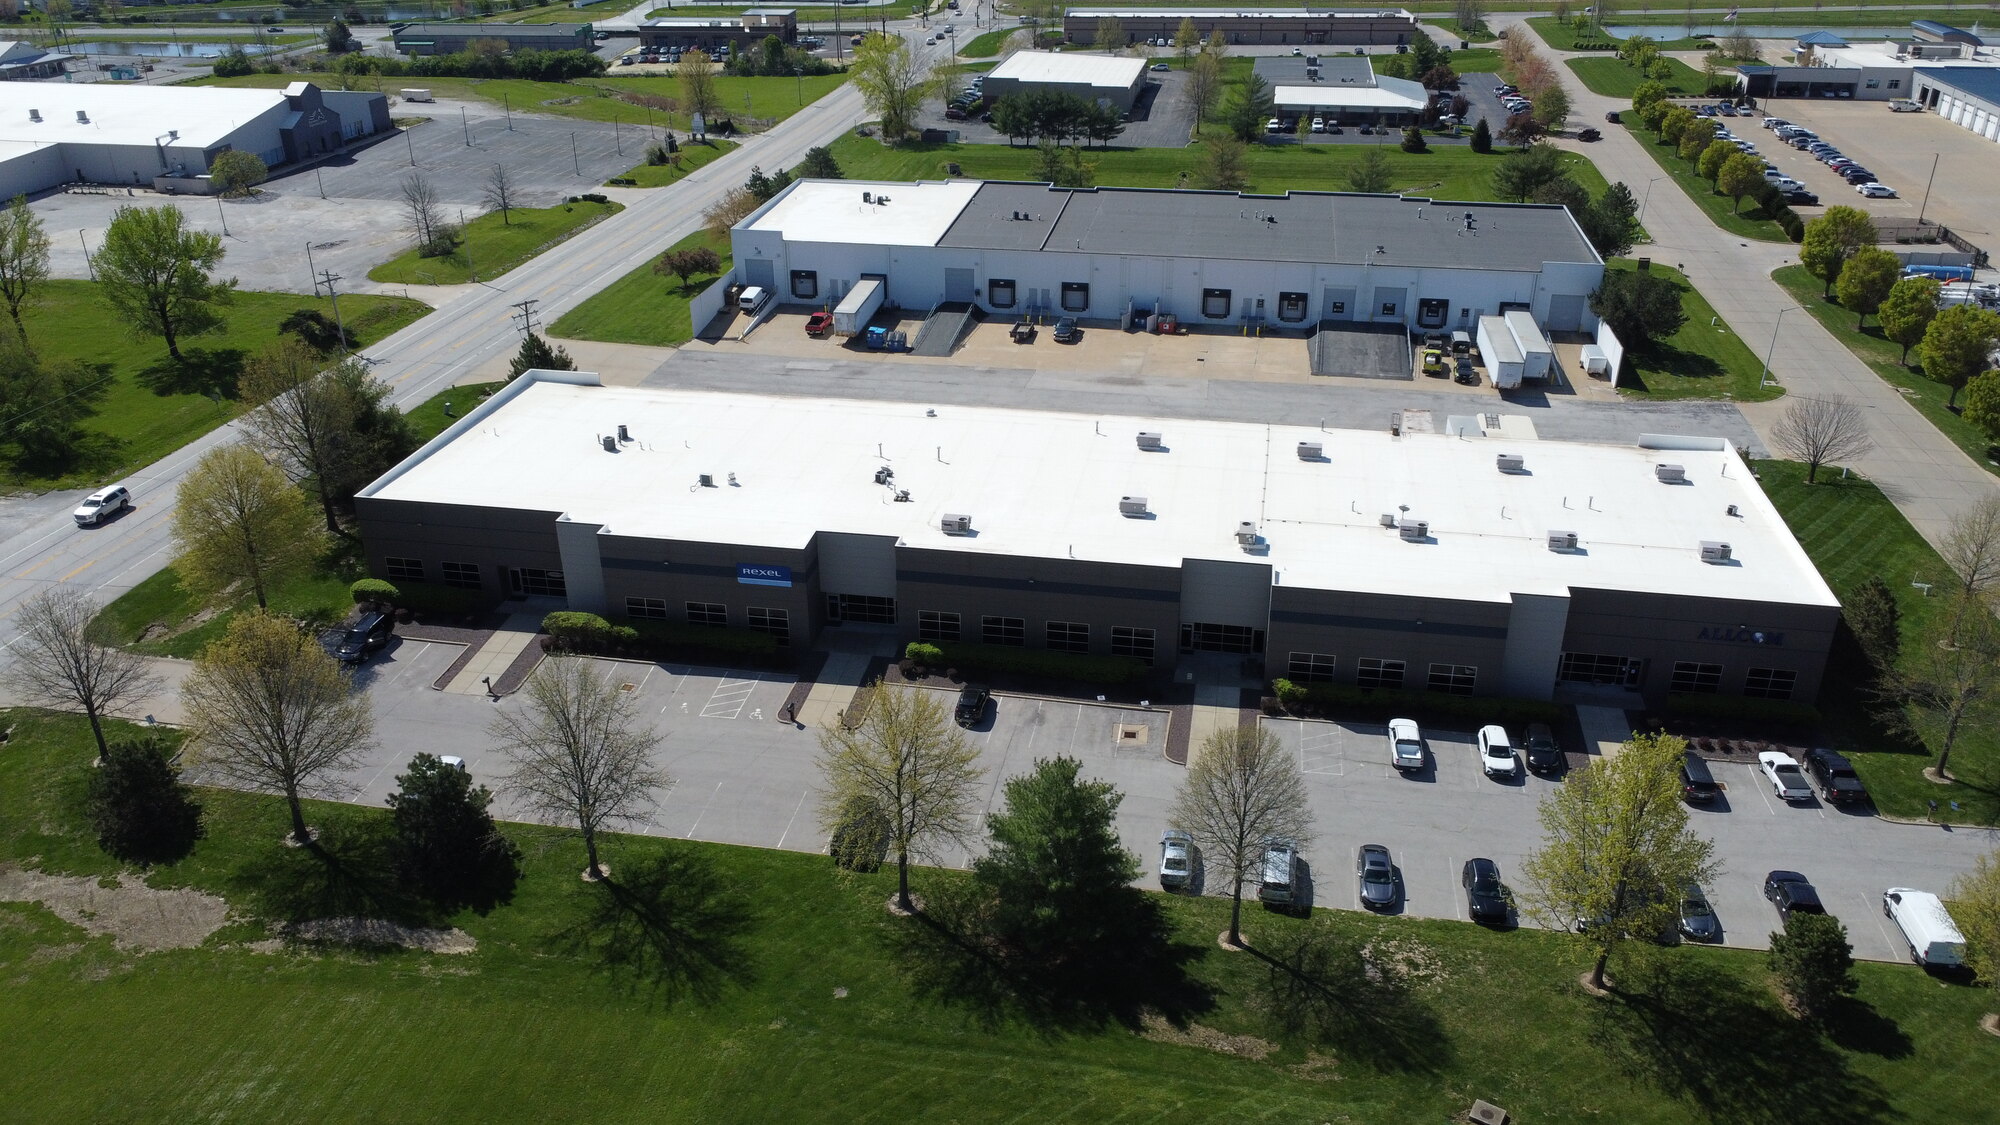
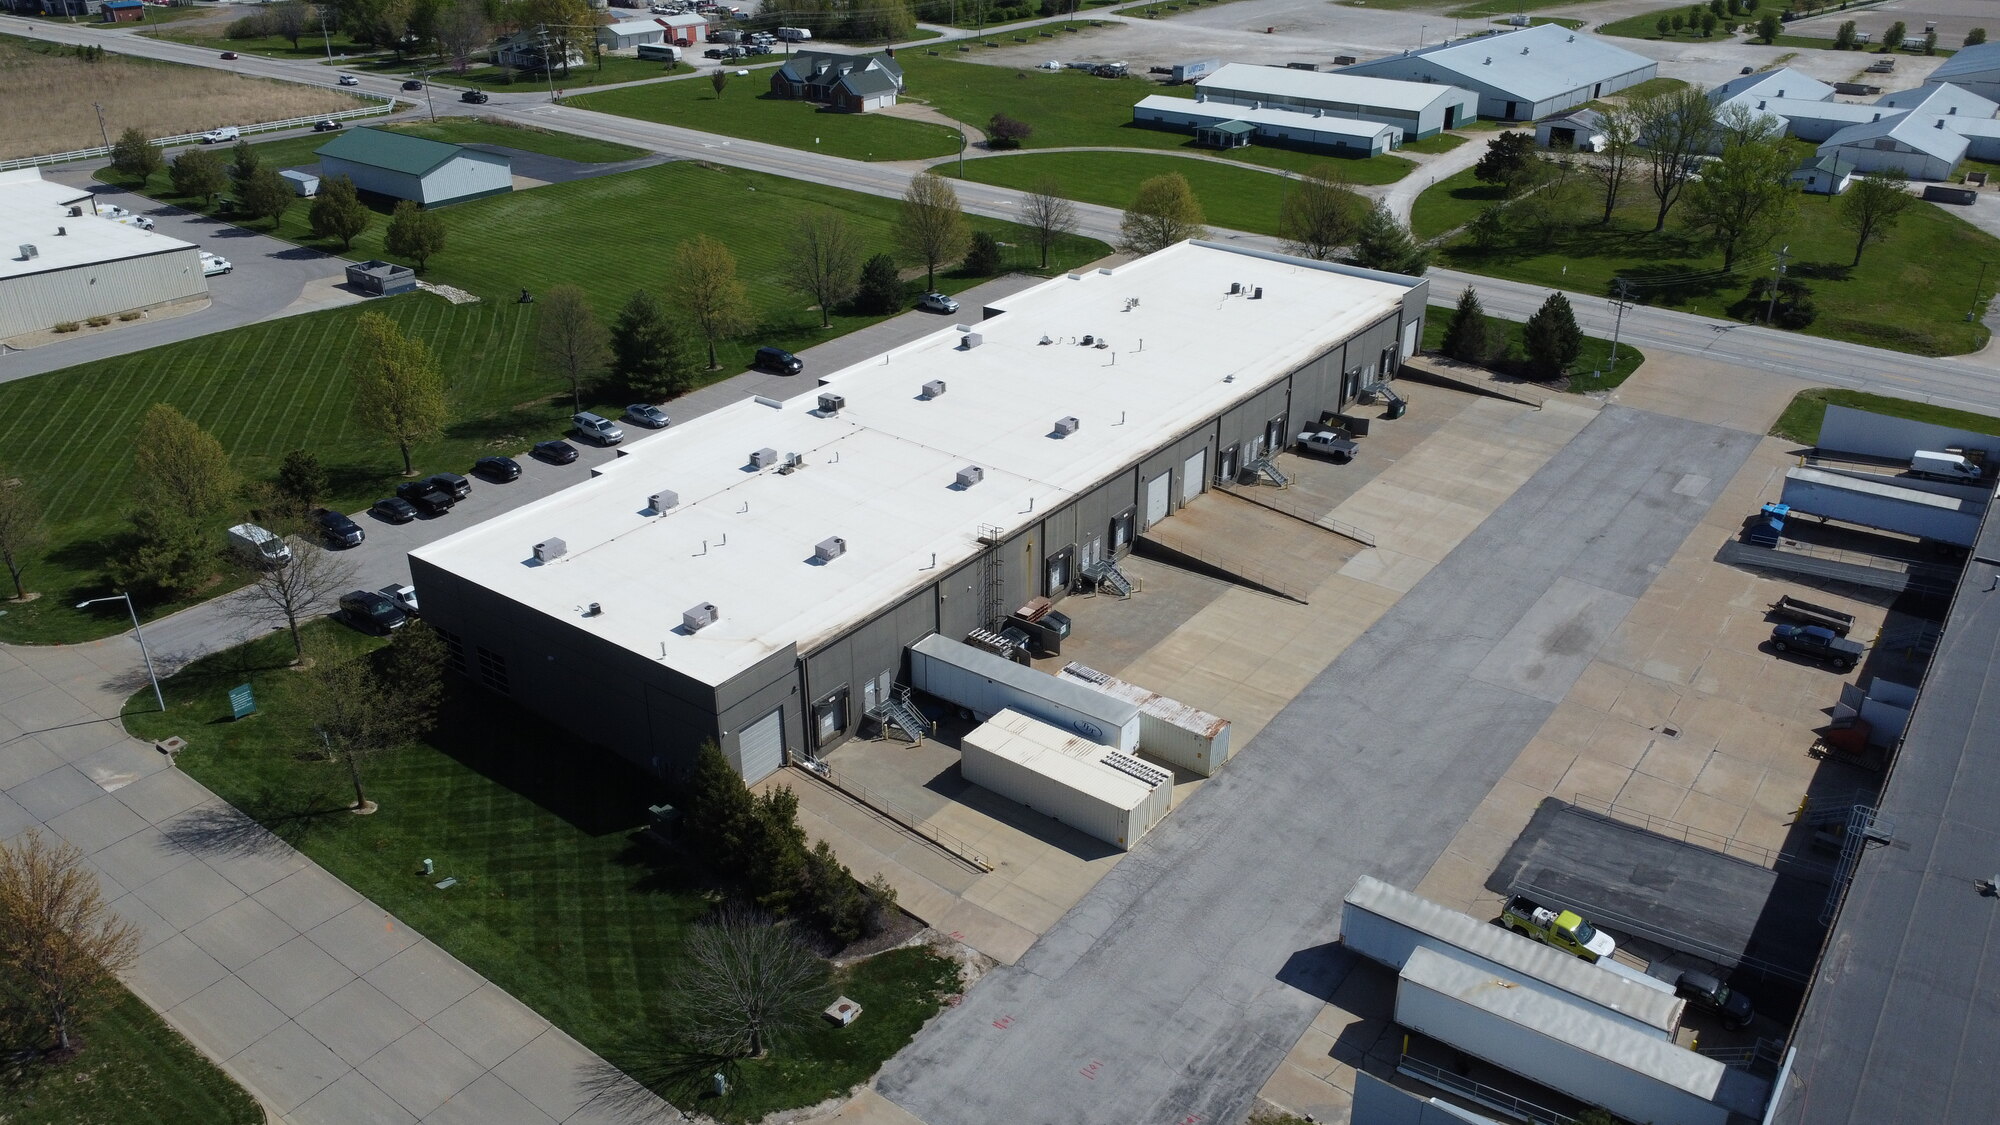
A 33,817 SF concrete tilt-up flex building (referred to in the appraisal as "Hawk Ridge Industrial Flex") delivered in 2002, with a 70% office finish, 21' clear height, dedicated dock-high and drive-in loading, and 3.47 / 1,000 SF parking — well above market — situated on 3.17 acres in the St. Charles County flex submarket.
| Address | 201–215 Stag Industrial Blvd, Lake St. Louis, MO 63367 |
| Submarket | St. Charles County (St. Louis MSA) |
| Asset Type | Multi-Tenant Industrial Flex |
| Total Building Area | 33,817 SF |
| Office Finish | ~70% (per CBRE appraisal) |
| Land Area | 3.17 acres |
| Year Built | 2002 |
| Clear Height | 21' |
| Loading | 8 dock-high (9'×10') with levelers; 4 drive-in (12'×14') |
| Parking | 118 surface spaces (3.47 / 1,000 SF) |
| Construction | Concrete tilt-up |
| Power | 1,200 AMP / 3-Phase |
| Sprinklers | Wet |
| Zoning | Industrial (I) |
| Occupancy at Closing | 100% |
| Number of Tenants | 4 |
| Weighted Avg. Lease Term | ~1.71 years at acquisition |
Physical specifications confirmed via CBRE appraisal (June 2025), ALTA survey, Phase I ESA, and the executed PSA. Building area is consistent across the IM, OM, appraisal, and recorded survey.
The rent roll is intentionally diversified — AllCom Global Services, the largest tenant, accounts for just 30% of the building. The 1.71-year WALT is a feature: three of four leases roll inside 24 months, accelerating the path to capturing the 28% gap between in-place and market rents.
| Tenant | Suite | SF | % of Bldg | Base Rent PSF (NNN) | Lease Expires |
|---|---|---|---|---|---|
| AllCom Global Services, Inc. | 201 | 10,155 | 30.0% | $7.50 | Apr 2026 |
| Rexel USA, Inc. | 209 & 211 | 8,832 | 26.1% | $7.65 | Mar 2028 |
| Lab Storage Systems, Inc. | 213–215 | 8,309 | 24.6% | $6.25 | Feb 2027 |
| U.S. Fabric Solutions, LLC | 205 & 207 | 6,521 | 19.3% | $8.25 | Apr 2026 |
Source: rent roll at acquisition (July 2025). Rents shown are in-place contractual base rent (NNN), excluding CAM reimbursements. All four leases include contractual annual escalations; weighted-average in-place rent is $7.38 PSF NNN versus comparable submarket asking rents of $10.21 PSF (~28% mark-to-market gap). The UW model assumes 75% renewal probability, 6 months downtime between tenants, and 3 months free rent on new leases.
Brief credit and business profile for each tenant. Lease abstracts and full financial disclosures are included in the investor data room.
Suite 201 · 10,155 SF (30.0% of building)
IT and network-infrastructure integrator providing engineers, project managers, and installers for enterprise and government clients. Uses the Stag space as its regional staging and project-deployment hub.
Suites 209 & 211 · 8,832 SF (26.1% of building)
U.S. subsidiary of Rexel Group (Euronext Paris: RXL) — a global electrical-distribution leader operating 400+ branches across the U.S. with corporate headquarters in Dallas, TX. The Stag location serves as a regional distribution branch.
Suites 213–215 · 8,309 SF (24.6% of building)
Designer and manufacturer of laboratory storage systems for anatomic pathology — a 45+ year operator serving hospital and reference labs. Capital-intensive build-out and specialized HVAC make this tenant structurally sticky at this location.
Suites 205 & 207 · 6,521 SF (19.3% of building)
Family-owned discount home-decor retailer and wholesaler (operates as HouseFabric.com) — upholstery, drapery, and outdoor fabric product lines. Holds a ROFR on adjacent suites and an option to purchase the building.
WALT of 1.71 years at acquisition means three of four leases roll inside 24 months — a feature, not a flaw, that accelerates the path to mark-to-market. The schedule below shows each rollover event, the % of building at risk, and the UW model assumption.
| Year | Tenant | SF | % of Building | % of Y1 NOI | Model Assumption | Risk |
|---|---|---|---|---|---|---|
| 2026 | AllCom Global Services | 10,155 | 30.0% | ~31% | 75% renewal · ~$9.50 PSF · 6-mo downtime | Moderate |
| 2026 | U.S. Fabric Solutions | 6,521 | 19.3% | ~22% | 75% renewal · ~$9.50 PSF · 6-mo downtime | Moderate |
| 2027 | Lab Storage Systems | 8,309 | 24.6% | ~21% | 75% renewal · ~$8.50 PSF · 6-mo downtime | Low (sticky tenant) |
| 2028 | Rexel USA | 8,832 | 26.1% | ~26% | Two 3-yr renewal options at market · 0-mo downtime | Low (option) |
Re-leasing rents, downtime, TI/LC, and renewal probabilities are estimates from the underwriting model. UW assumptions: 75% renewal probability, 6 months downtime between tenants, 3 months free rent (new) / 0 months (renewals), TI of $7.00 PSF (new) / $1.00 PSF (renewal), LCs of 7.5% (new) / 4.0% (renewal). The model probability-weights renewal vs. re-lease scenarios per tenant.
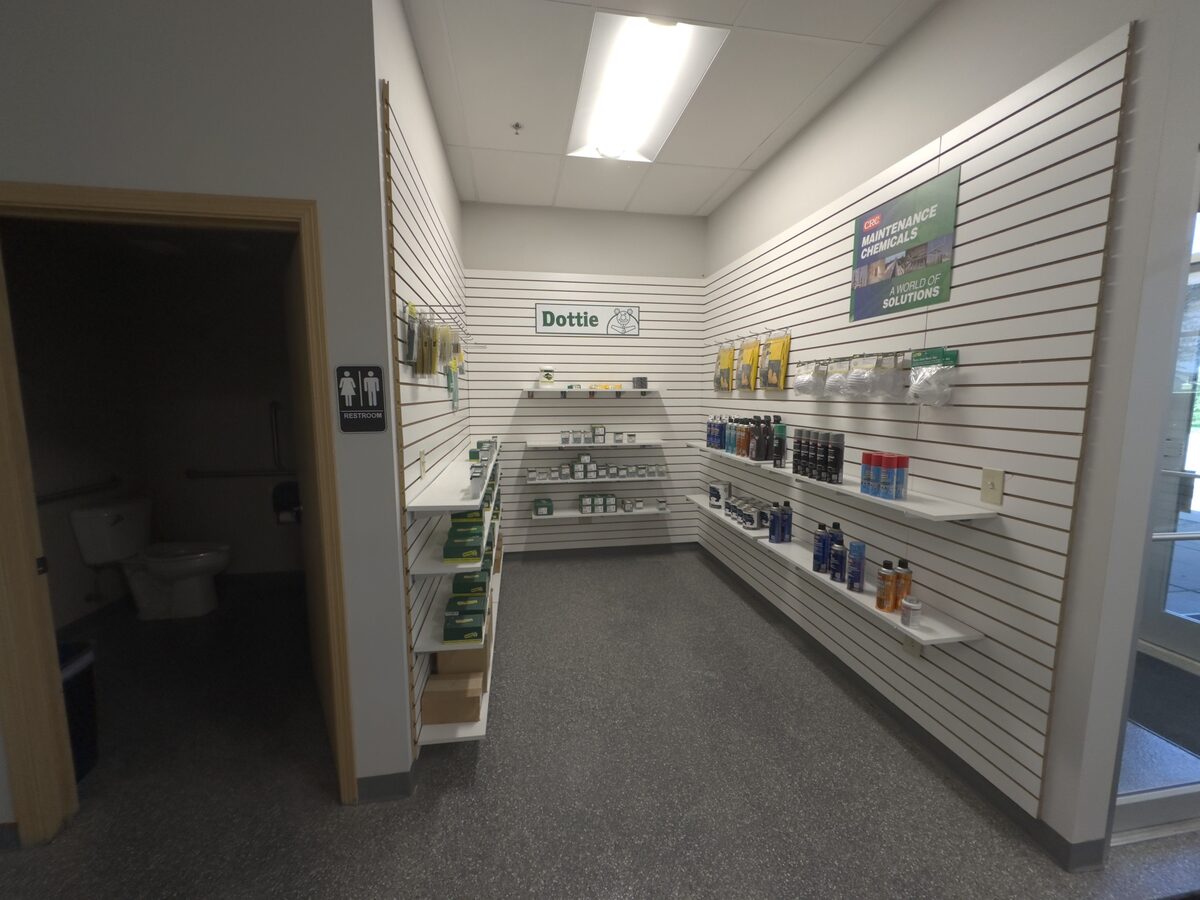
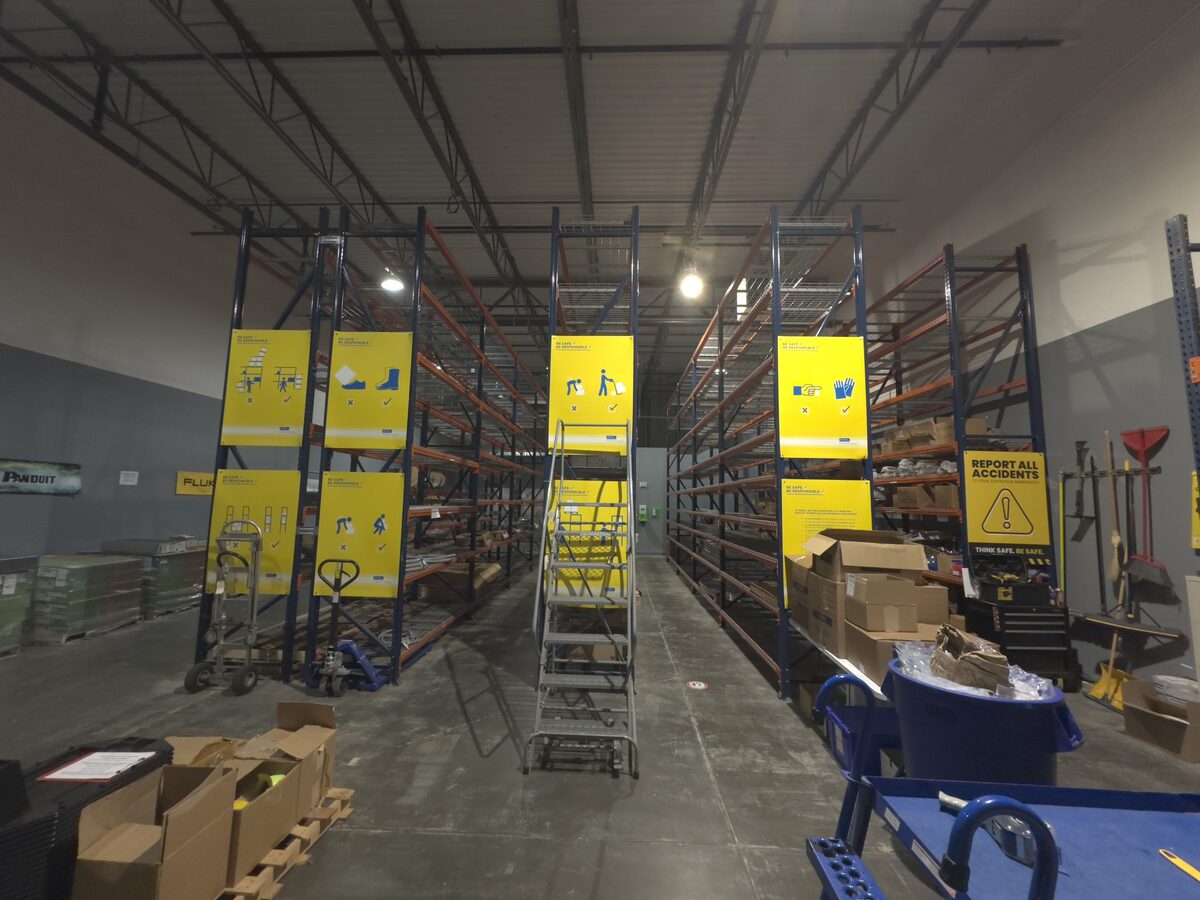
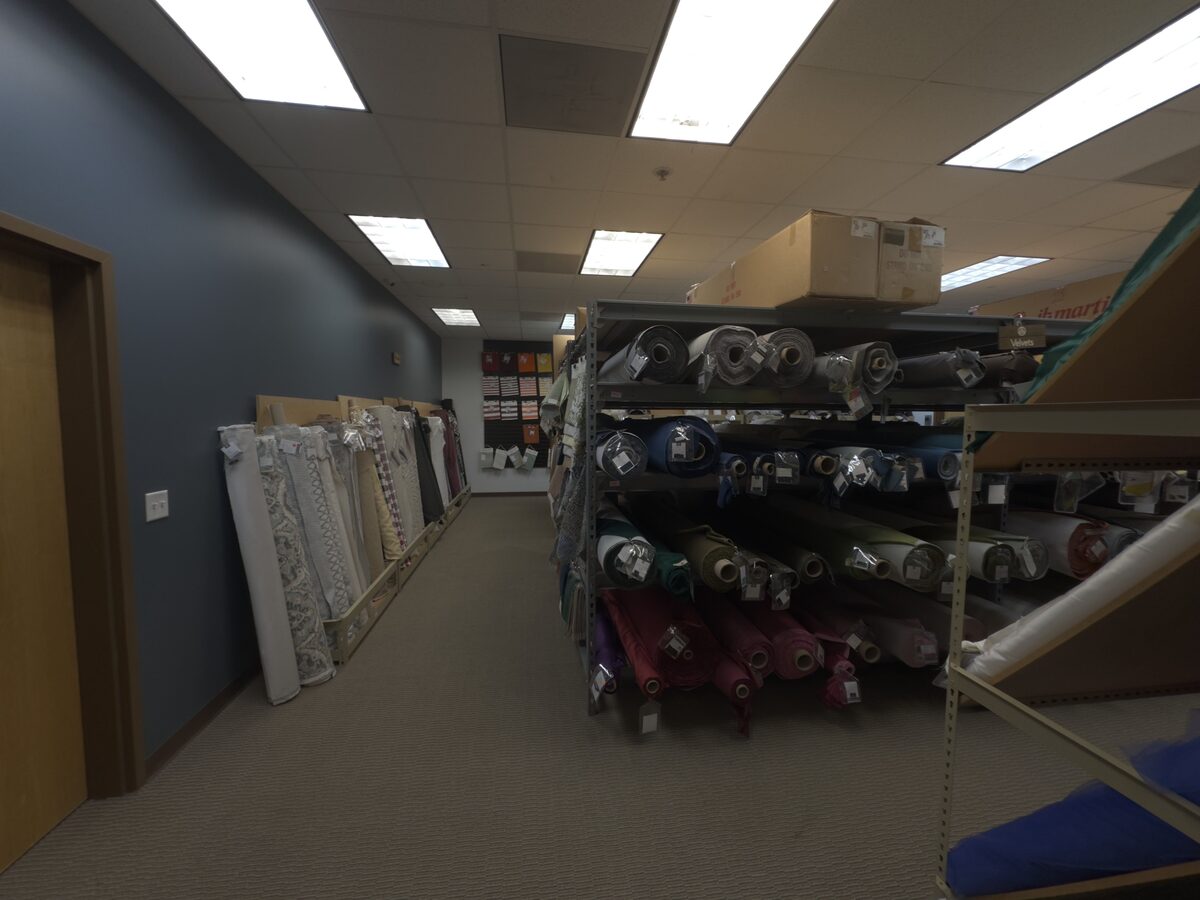
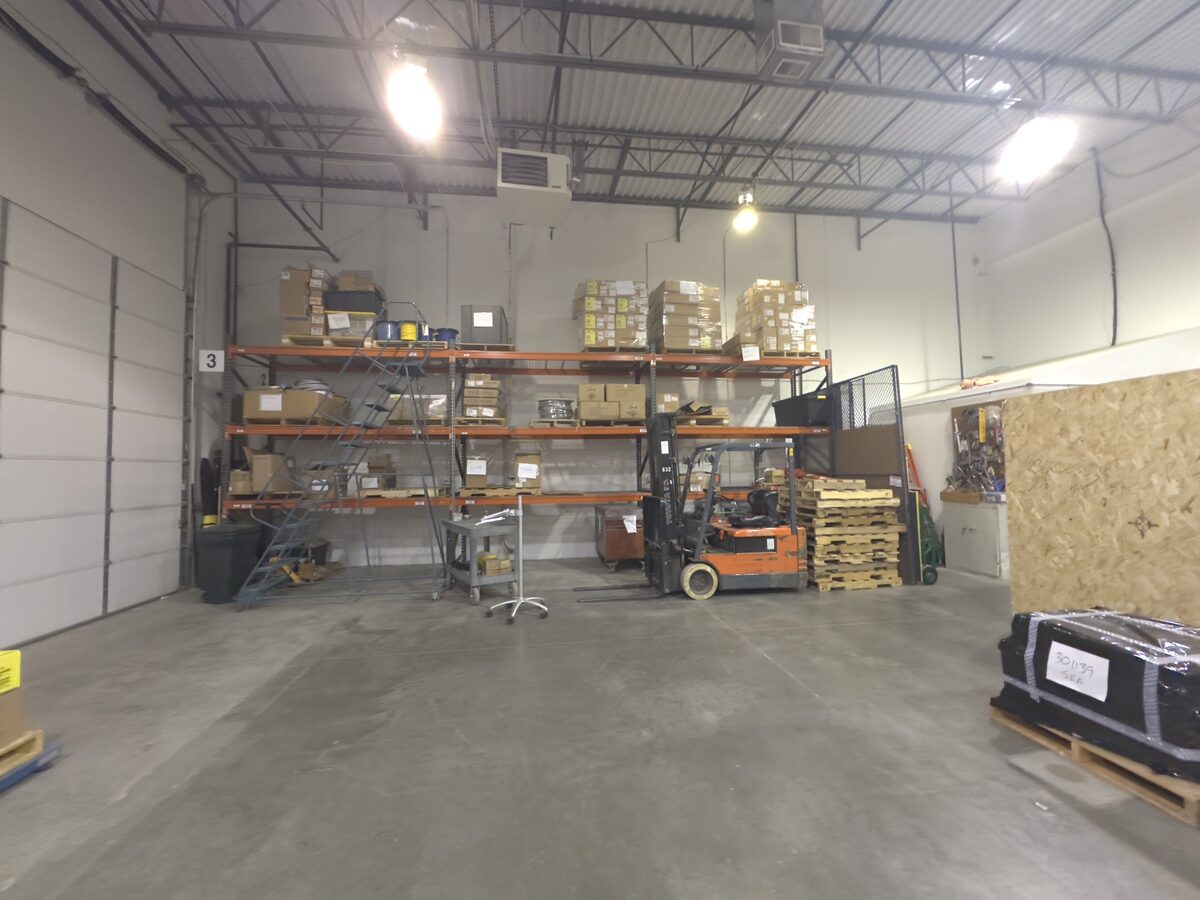
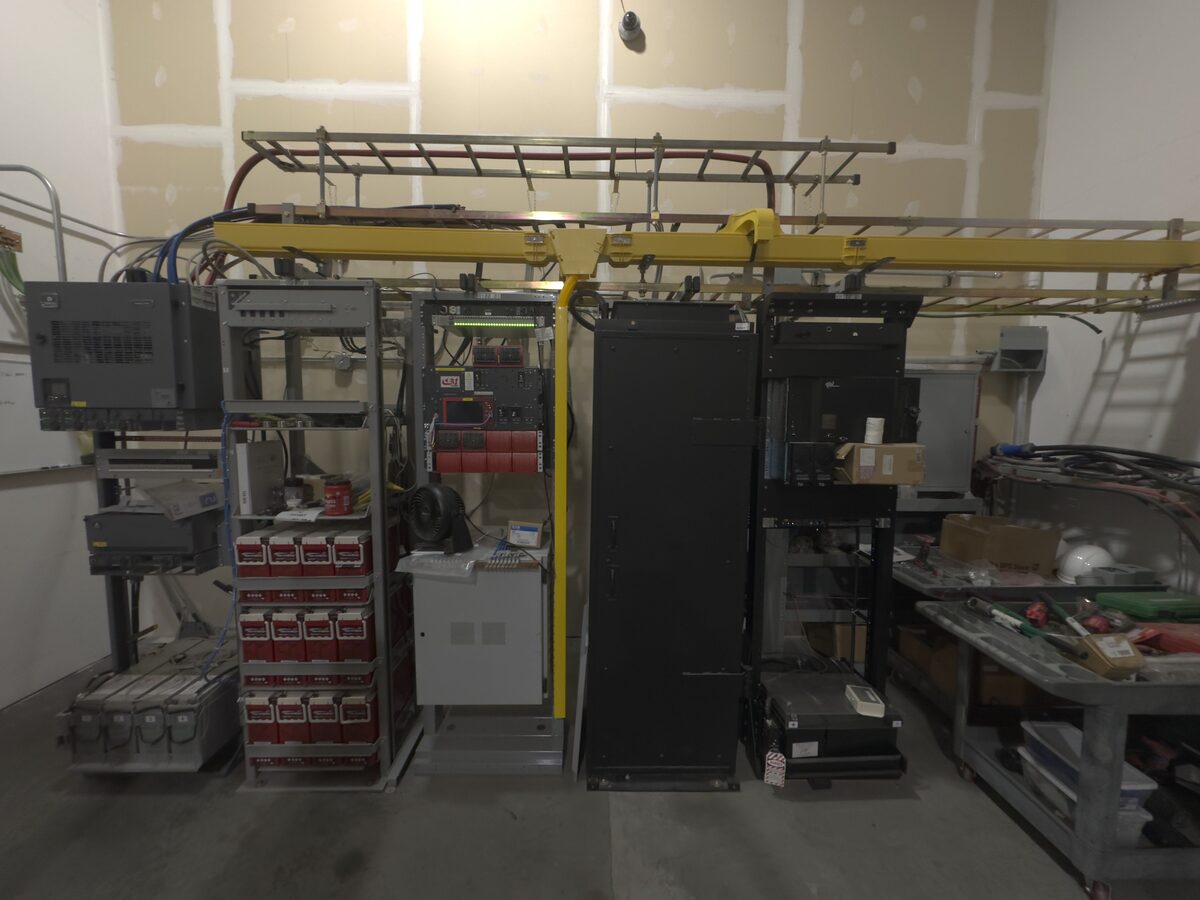
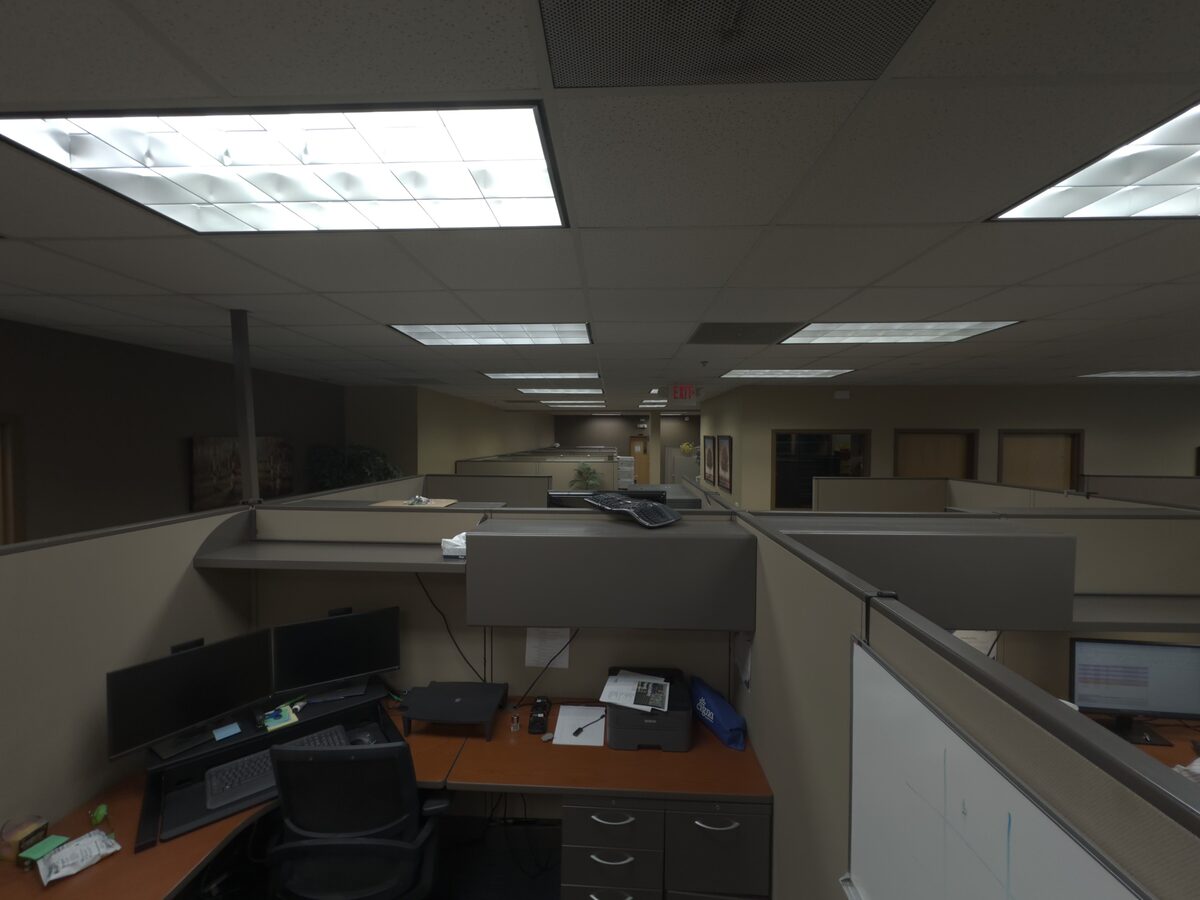
On-site interior photography from April 2025 due diligence — Rexel's electrical-distribution branch, U.S. Fabric Solutions' showroom, and AllCom's network & staging operations. Diversified tenant uses, capital-intensive build-outs, and signs of long-term occupancy across all four suites.
Photography from April 2025 on-site walk-through with each tenant. Capital-intensive build-outs (Rexel showroom, AllCom network gear, U.S. Fabric retail floor) make these tenants structurally sticky — relocating costs them more than renewing.
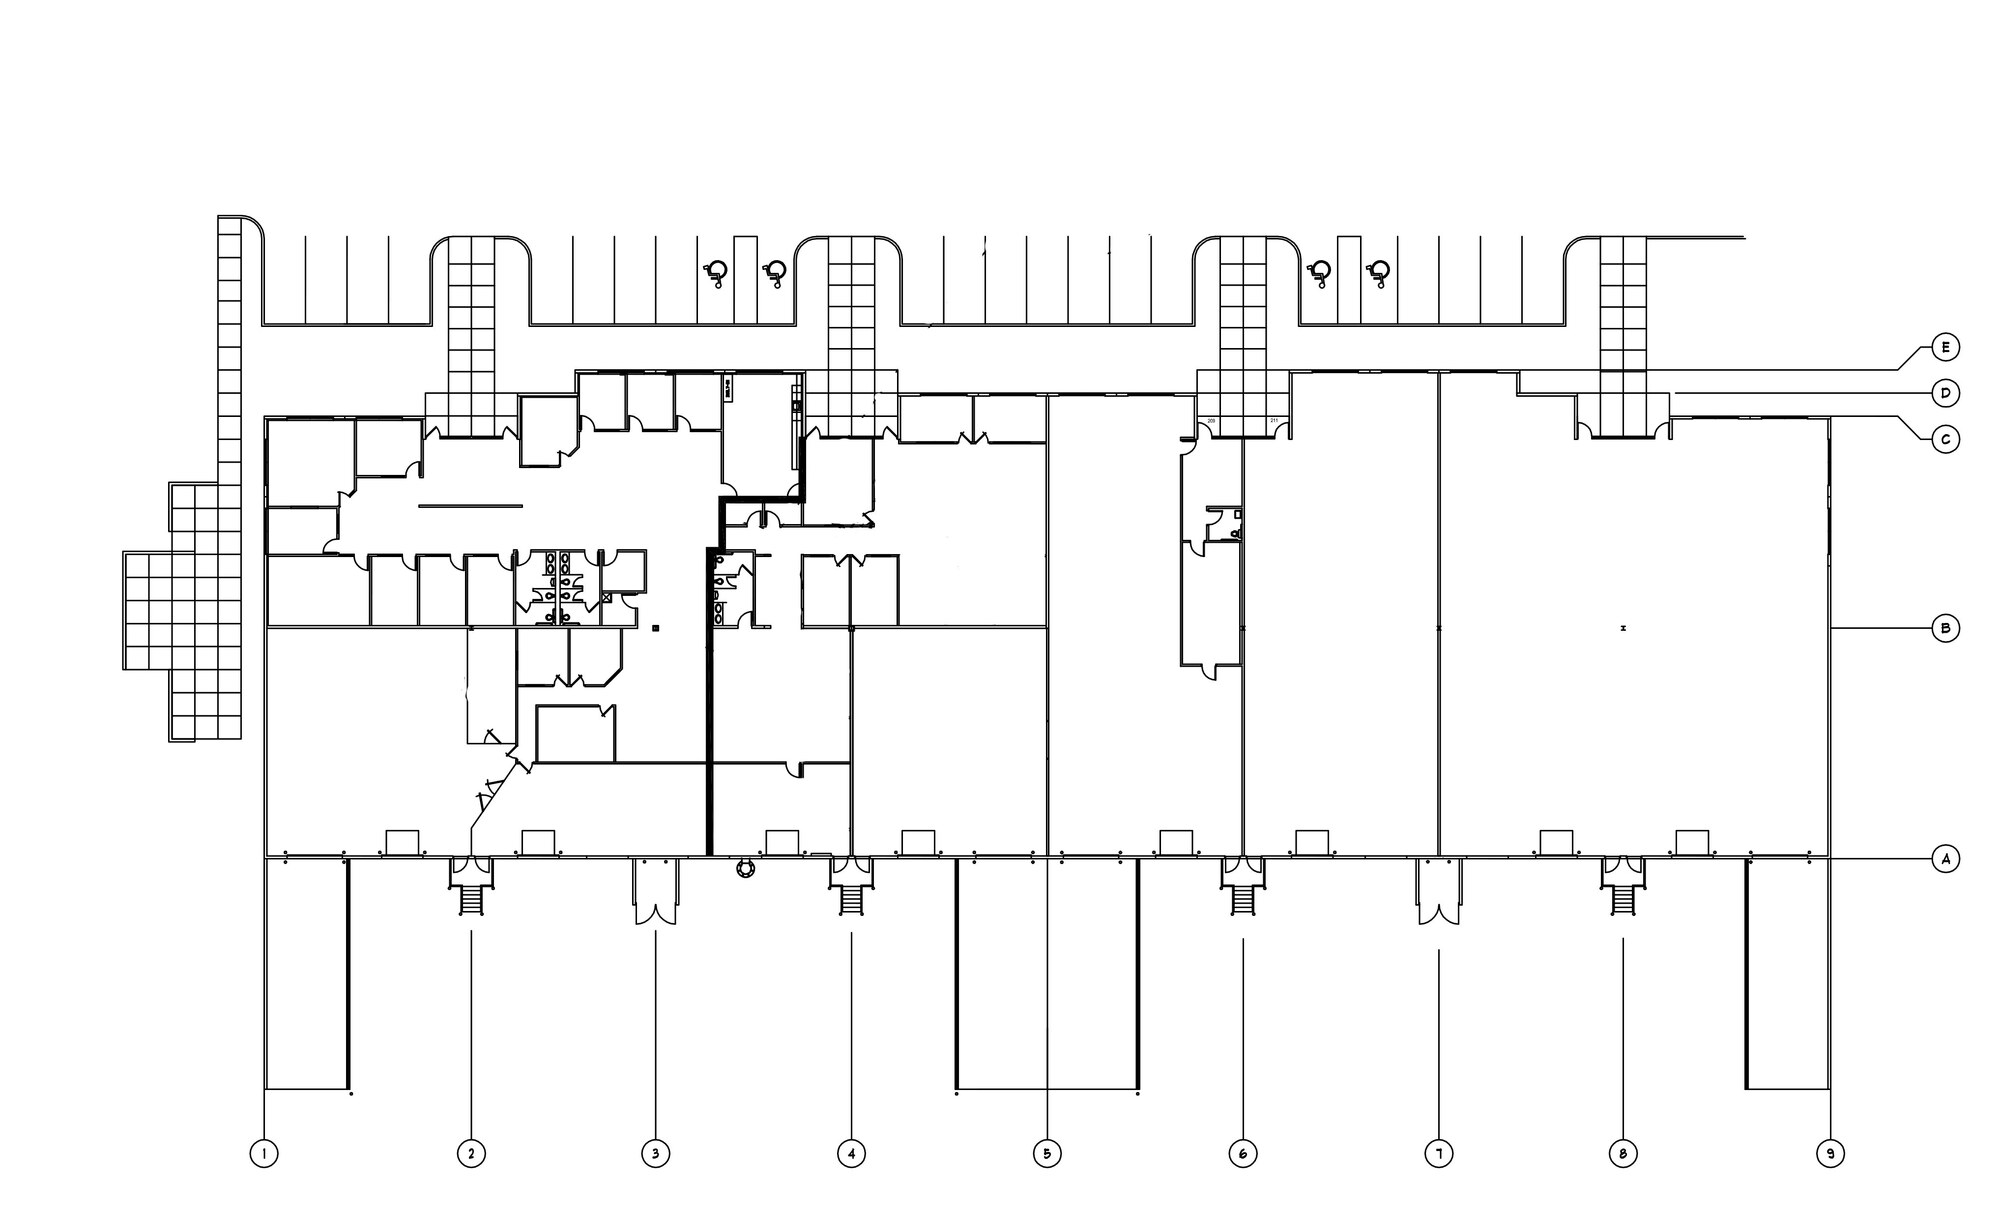
The building was originally designed and demised for four tenants ranging from ~6,500 to ~10,200 SF — a sweet spot for the kind of regional service, light-industrial, and distribution users that drive demand in the St. Charles flex submarket. Every demising wall sits on a structural grid line, so combining or splitting suites at lease rollover is straightforward.
St. Charles County is a 419,000-resident, 16%-population-growth-since-2010 corridor between Lambert International Airport and the I-70 / I-64 nodes. The county is anchored by major employers including General Motors, Boeing, MasterCard, and Amazon. New flex development has slowed dramatically — only 61,000 SF currently under construction versus the 10-year average of 550,000 SF — with sub-1% vacancy in product under 50,000 SF.
| Property | SF | Asking Rent | vs. Stag In-Place |
|---|---|---|---|
| 4013 Old Hwy 94 S · St. Charles County | 6,250 | $12.00 | +62.6% |
| 1100 Pralle Ln · St. Charles County | 8,400 | $12.00 | +62.6% |
| 3080 Elm Point Industrial Dr · St. Charles County | 15,120 | $8.50 | +15.2% |
| 3896 Fountain Lakes Pkwy · St. Charles County | 10,725 | $9.50 | +28.7% |
| 3355 E Terra Ln · St. Charles County | 6,000 | $10.50 | +42.3% |
| 201–215 Stag Industrial Blvd (Subject — In-Place) | 33,817 | $7.38 wtd avg | — |
| Comparable Average Asking Rent | — | $10.21 | +38.3% |
Submarket statistics from the IM (sourced from CoStar and broker comp sets at acquisition). Comparable lease comps reflect direct submarket transactions in St. Charles County flex product under 16,000 SF. The 28% in-place-to-market gap is the central driver of the 5-year value-creation thesis.
5-year hold underwriting from the V3 Base Case model used at acquisition. Assumptions reflect 75% renewal probability, 6 months downtime between tenants, 3 months free rent on new leases, 3.0% annual rent escalations, 2.5% expense growth, and a 7.45% terminal cap exit in mid-2030.
NOI figures, return metrics, cash-on-cash yields, and cap rates shown are the forward-looking estimates from the V3 Base Case underwriting model used at acquisition (July 2025). They rely on assumptions about lease renewals, re-leasing rents, expense inflation, debt terms, and exit cap rate environment that may not be realized. Actual operating results and investor returns will differ from these estimates.
| Exit Cap | Gross Sale Price | LP IRR | LP EM | Δ IRR vs Base |
|---|---|---|---|---|
| 6.75% (Upside) | $5.44M | 17.2% | 2.06x | +320 bps |
| 7.00% | $5.24M | 16.0% | 1.99x | +200 bps |
| 7.25% | $5.06M | 14.9% | 1.92x | +90 bps |
| 7.45% (Base) | $4.93M | 14.0% | 1.84x | — |
| 7.75% | $4.73M | 12.7% | 1.75x | -130 bps |
| 8.25% | $4.45M | 10.5% | 1.61x | -350 bps |
| 8.75% (Downside) | $4.19M | 8.4% | 1.48x | -560 bps |
Sensitivity figures are illustrative estimates calibrated to the V3 Base Case ($1.55M LP equity, 14.0% target IRR / 1.84x EM at the 7.45% base exit cap). Each row holds NOI and debt assumptions constant and varies only the terminal cap. Additional sensitivities (rent growth, vacancy, TI/LC, hold extension) appear in the full underwriting package.
Financed with a 10-year fixed-rate first mortgage at 6.41% from TruStone Financial Credit Union (originated through Servion Commercial Loan Resources). Year 1 DSCR of 1.42x leaves cushion for the rollover-and-roll plan; LP equity of $1.55M was raised under a Reg D Rule 506(b) offering to accredited investors.
Sources & uses, loan terms, and DSCR figures reflect the actual closing terms (July 2025) per the executed PSA and TruStone Financial Credit Union loan documents. Acquisition fee was paid one-time at close to the sponsor.
Fees are fully disclosed below and already reflected in the net-to-LP return figures shown throughout this page. Full fee schedule and distribution waterfall are defined in the Operating Agreement of Bluebird Stag, LLC.
Select an investment size to preview projected LP cash flows, return of capital, and profit over the 5-year hold. Distributions are pro-rata against the $1,550,000 total LP equity raise. Minimum investment in the actual offering was $5,000 under Reg D Rule 506(b).
| Period | Operating Dist. | Capital Events | Total |
|---|
Illustrative only. All cash flow, distribution, IRR, and equity multiple figures shown are estimates pro-rated from the V3 Base Case underwriting model on $1,550,000 LP equity: Year 1 $0 (lease-up year) · Years 2–5 ~$77,500/yr operating distributions · plus the projected Year 5 sale distribution of approximately $2.0M to LPs (return of capital + profit). These reflect the underwriting assumptions at acquisition (July 2025) and are not a promise or guarantee of future results. Distribution waterfall: 95/5 LP/GP to a 10% preferred return, then 80/20 thereafter. Not an offer to sell securities.
The actual six-phase execution plan that took Stag from broker introduction to closed and funded over a 90-day window.
Sourced through Summit's St. Louis broker network from RL Sallee Real Estate Investments, LLC (Avison Young — Dan Cahill, sell-side). LOI submitted at $3.6M with 35-day diligence window.
Purchase & Sale Agreement executed with $25,000 initial earnest money. Counsel: Spencer Fane (buyer) and Lewis Rice (seller). First American Title as escrow agent.
35-day diligence window covering CBRE appraisal, Phase I ESA, PCA, structural and roof review, tenant interviews and estoppel collection, and full lease abstraction. Additional $25,000 deposit posted on June 10 (deposit non-refundable from that point).
Senior debt sized at $2.3M (~64% LTV) with TruStone Financial Credit Union via Servion Commercial Loan Resources. Rate locked at 6.41% on a 10-year fixed term with 30-year amortization.
$1.55M equity raise from accredited investors and family offices under Reg D Rule 506(b) — $5,000 minimum investment. Bluebird Stag, LLC (Missouri pass-through) formed as the holding entity. Closed July 2025.
Active asset management with quarterly investor reporting. Lease renewal strategy targets the three near-term rollovers (AllCom & U.S. Fabric in 2026, Lab Storage in 2027) to capture the 28% in-place-to-market rent gap. Targeted exit mid-2030 at a 7.45% terminal cap — projected 14.0% LP IRR and 1.84x equity multiple.
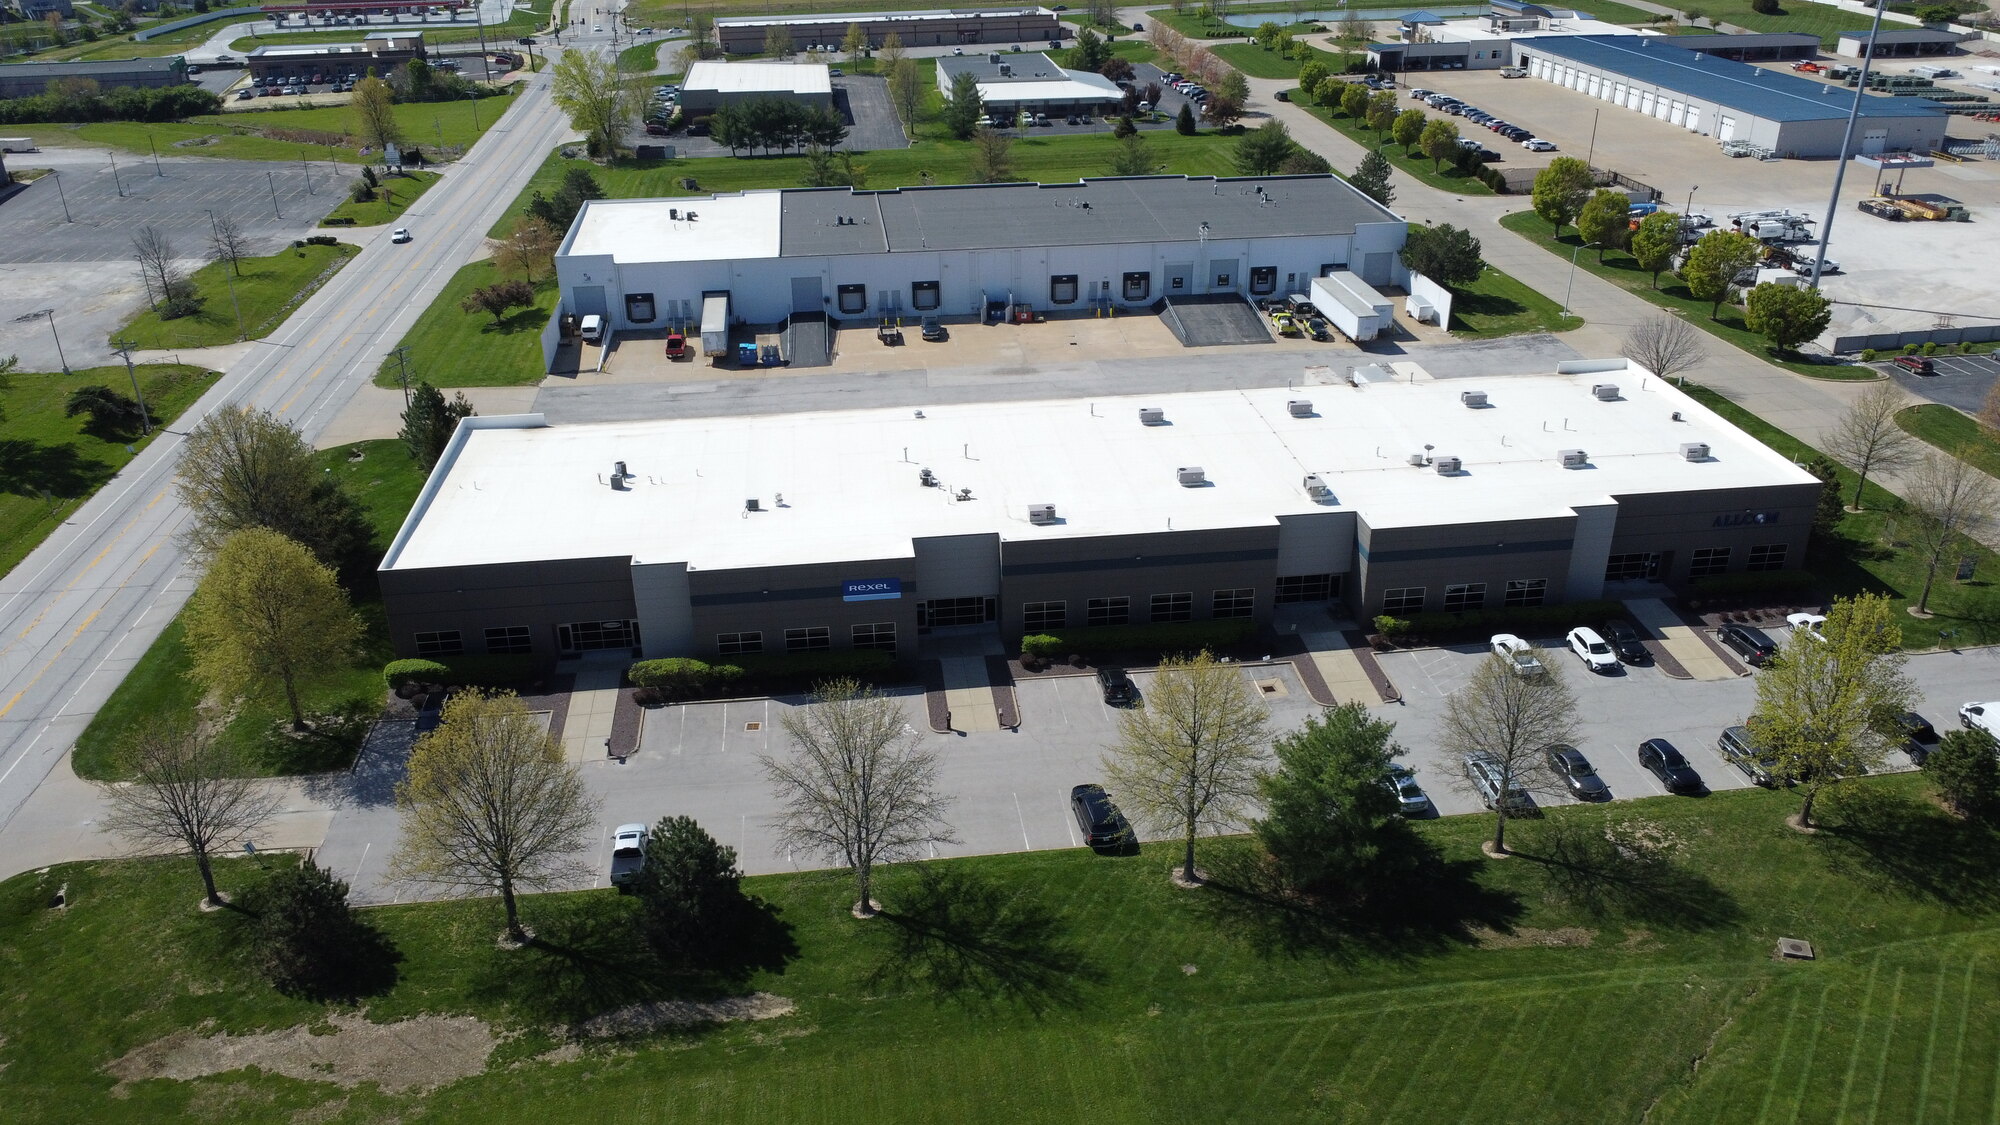
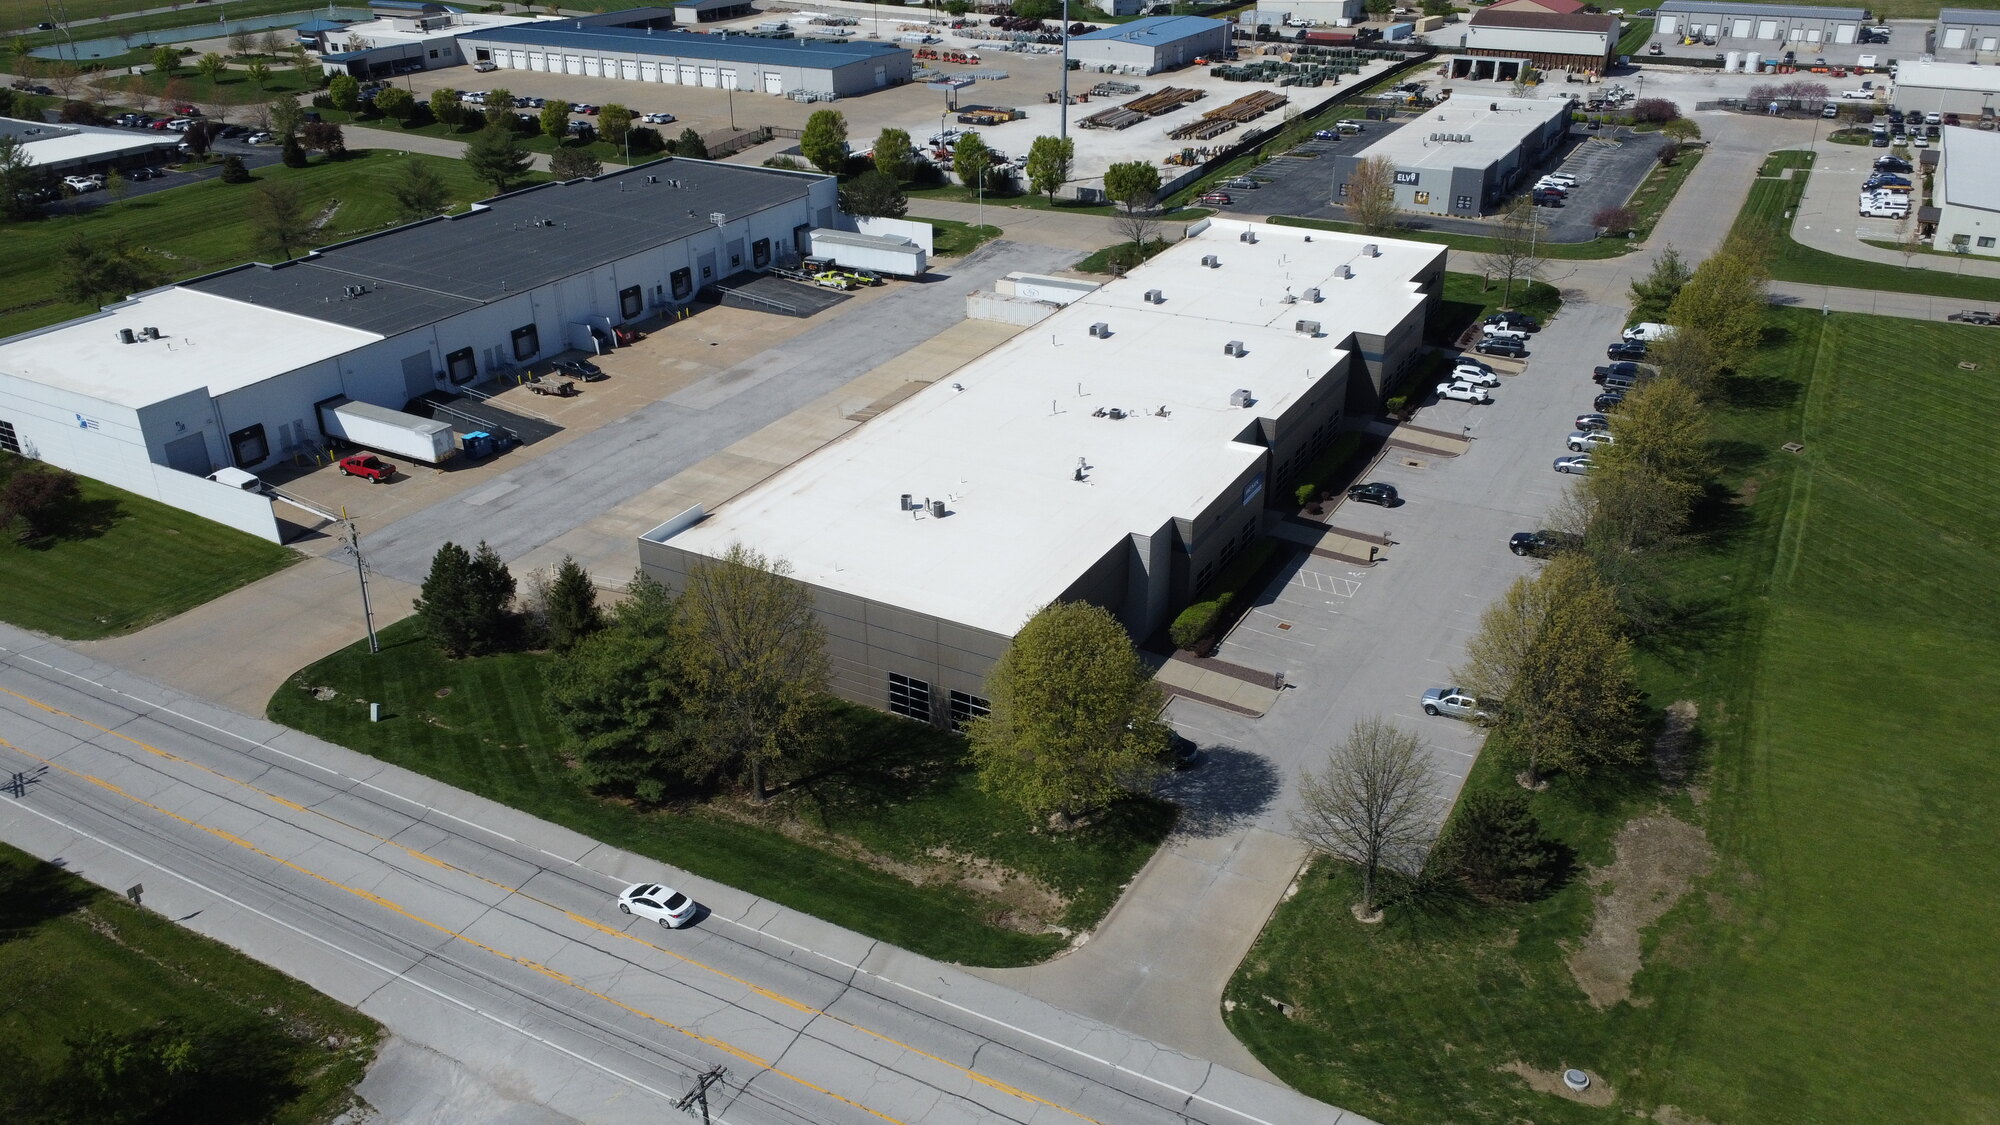
4K aerial photography and on-site interior photography of 201–215 Stag Industrial Blvd captured during diligence in April 2025 (pre-acquisition).
Bluebird is led by experienced principals with deep underwriting, leasing, and asset-management track records across the Midwest industrial corridor.

Cody has been involved in over $750M of commercial real estate transactions, the majority focused on industrial assets across the Midwest. He holds advanced degrees in Real Estate (Chapman University) and Investment Management & Financial Analysis (Creighton University), along with a B.S. in Finance from Azusa Pacific.

Kevin has 20+ years in commercial real estate with 300+ closed sale transactions. Previously a Managing Director at Lincoln Property Company and Studley (now Savills North America). He holds a B.A. in Communications and Economics from Boston College.
Bluebird's principals have collectively underwritten and transacted on more than $750M of commercial real estate, the majority focused on Midwest industrial. The Stag acquisition is part of an 11-property, ~450,000 SF portfolio held by Bluebird's principals and affiliated entities. The GP contributed personal capital alongside the LP raise on Stag — direct sponsor co-investment is standard practice on every Bluebird syndication.
Detailed property-level transaction history — including hold periods and realized vs. unrealized results — is available under NDA. Prior individual-level track record does not constitute a track record of Bluebird as a firm, and past performance is not indicative of future results.
Eleven Midwest industrial assets totaling nearly 450,000 square feet, held at low basis and actively managed through Bluebird's vertically integrated platform with Summit Real Estate Services.
| # | Property | Market | Type | SF | Year |
|---|---|---|---|---|---|
| 1 | 201–215 Stag Industrial Blvd · SUBJECT Lake St. Louis, MO | St. Louis | Multi-tenant flex | 33,817 | 2025 |
| 2 | 1285 West Terra Lane O'Fallon, MO | St. Louis | Industrial / IOS | 18,858 | 2025 |
| 3 | 7834–7842 N Faulkner Rd Milwaukee, WI | Milwaukee | Multi-tenant flex | 29,747 | 2024 |
| 4 | 10605 Trenton Avenue St. Louis, MO | St. Louis | Single-tenant | 18,720 | 2024 |
| 5 | 4333 W 71st Street Indianapolis, IN | Indianapolis | Large-format | 179,725 | 2023 |
| 6 | 3015 South 163rd Street New Berlin, WI | Milwaukee | Industrial | 52,260 | 2023 |
| 7 | 9415 Dielman Rock Island Dr St. Louis, MO | St. Louis | Flex industrial | 26,778 | 2022 |
| 8 | W141 N9501 Fountain Blvd Menomonee Falls, WI | Milwaukee | Single-tenant | 38,768 | 2022 |
| 9 | 5161 Wolfpen-Pleasant Hill Rd Milford, OH | Cincinnati | Single-tenant | 20,925 | 2022 |
| 10 | N117 W18654 Fulton Drive Germantown, WI | Milwaukee | Industrial | 20,080 | 2022 |
| 11 | 4115 SW Southgate Drive Topeka, KS | Topeka | Flex industrial | 10,080 | 2021 |
| Portfolio Total | 5 markets | — | 449,758 | 2021–2025 |
Portfolio reflects assets held by Bluebird's principals and affiliated entities through Summit Real Estate Services across St. Louis, Milwaukee, Cincinnati, Indianapolis, and Topeka. 201–215 Stag Industrial Blvd is the highlighted subject of this sample microsite. Property-level purchase prices, business plans, and realized performance are available under NDA. Past principal-level performance does not constitute a track record of Bluebird as a firm and is not indicative of future results.
Both 2026 lease expirations have been signed at above-market rents, validating the central underwriting thesis. The two near-term rollovers that drove the value-creation case are now de-risked.
Renewal terms confirmed by executed lease amendments. Forward IRR projection updated upward but not yet republished here — contact Bluebird for the revised pro forma. Lab Storage Systems (Feb 2027 expiry) and Rexel USA (Mar 2028 expiry) remain as the next two rollover events.
This sample microsite was built by Bluebird Commercial Real Estate as a representative example of how we present a syndicated deal to investors. Bluebird builds investor microsites for CRE syndication sponsors raising capital under Reg D. Inquire about a microsite for your next deal →
Send a one-line note about the deal you're raising for. We'll send back pricing, timeline, and a couple of clarifying questions. No obligation, no sales pitch on the first email.